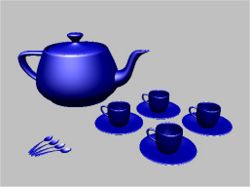
3D Graphics Teapot
It's madeof 32 bezier patches and you can easily
Code to do teapot in C++
Bézier Curves and Surfaces: the Utah Teapot
http://www.scratchapixel.com/lessons/advanced-rendering/bezier-curve-rendering-utah-teapot
find it if you google for "utah teapot"
I have some old class code from fall 2001 that does teapots via Bezier
patches:
http://www.cs.unc.edu/~vogel/COMP236/program3/index.html
Original teapot data
https://sjbaker.org/wiki/index.php?title=The_History_of_The_Teapot
Here is how one grad student renders a teapot:
http://vis.berkeley.edu/~joshea/projects/bezier/
The basic OpenGL functions for curves are (in C):
How to model a teapot
https://en.wikibooks.org/wiki/OpenGL_Programming/Modern_OpenGL_Tutorial_07It's madeof 32 bezier patches and you can easily
Code to do teapot in C++
Bézier Curves and Surfaces: the Utah Teapot
http://www.scratchapixel.com/lessons/advanced-rendering/bezier-curve-rendering-utah-teapot
find it if you google for "utah teapot"
I have some old class code from fall 2001 that does teapots via Bezier
patches:
http://www.cs.unc.edu/~vogel/COMP236/program3/index.html
Original teapot data
https://sjbaker.org/wiki/index.php?title=The_History_of_The_Teapot
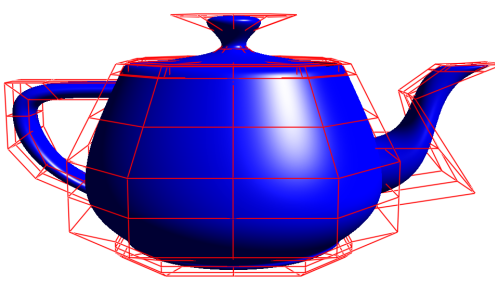
The Teapot DataSet

The teapot is made from nine patches - some reflected in two axes , others in one axis only.
Rim:
  { 102, 103, 104, 105,   4,   5,   6,   7,
        8,   9,  10,  11,  12,  13,  14,  15 }
  Body:
    {  12,  13,  14,  15,  16,  17,  18,  19,
       20,  21,  22,  23,  24,  25,  26,  27 }
    {  24,  25,  26,  27,  29,  30,  31,  32,
       33,  34,  35,  36,  37,  38,  39,  40 }
  Lid:
    {  96,  96,  96,  96,  97,  98,  99, 100,
      101, 101, 101, 101,   0,   1,   2,   3 }
    {   0,   1,   2,   3, 106, 107, 108, 109,
      110, 111, 112, 113, 114, 115, 116, 117 }
  Handle:
    {  41,  42,  43,  44,  45,  46,  47,  48,
       49,  50,  51,  52,  53,  54,  55,  56 }
    {  53,  54,  55,  56,  57,  58,  59,  60,
       61,  62,  63,  64,  28,  65,  66,  67 }
  Spout:
    {  68,  69,  70,  71,  72,  73,  74,  75,
       76,  77,  78,  79,  80,  81,  82,  83 }
    {  80,  81,  82,  83,  84,  85,  86,  87,
       88,  89,  90,  91,  92,  93,  94,  95 }

  Vertices:

    {  0.2000,  0.0000, 2.70000 }, {  0.2000, -0.1120, 2.70000 },
    {  0.1120, -0.2000, 2.70000 }, {  0.0000, -0.2000, 2.70000 },
    {  1.3375,  0.0000, 2.53125 }, {  1.3375, -0.7490, 2.53125 },
    {  0.7490, -1.3375, 2.53125 }, {  0.0000, -1.3375, 2.53125 },
    {  1.4375,  0.0000, 2.53125 }, {  1.4375, -0.8050, 2.53125 },
    {  0.8050, -1.4375, 2.53125 }, {  0.0000, -1.4375, 2.53125 },
    {  1.5000,  0.0000, 2.40000 }, {  1.5000, -0.8400, 2.40000 },
    {  0.8400, -1.5000, 2.40000 }, {  0.0000, -1.5000, 2.40000 },
    {  1.7500,  0.0000, 1.87500 }, {  1.7500, -0.9800, 1.87500 },
    {  0.9800, -1.7500, 1.87500 }, {  0.0000, -1.7500, 1.87500 },
    {  2.0000,  0.0000, 1.35000 }, {  2.0000, -1.1200, 1.35000 },
    {  1.1200, -2.0000, 1.35000 }, {  0.0000, -2.0000, 1.35000 },
    {  2.0000,  0.0000, 0.90000 }, {  2.0000, -1.1200, 0.90000 },
    {  1.1200, -2.0000, 0.90000 }, {  0.0000, -2.0000, 0.90000 },
    { -2.0000,  0.0000, 0.90000 }, {  2.0000,  0.0000, 0.45000 },
    {  2.0000, -1.1200, 0.45000 }, {  1.1200, -2.0000, 0.45000 },
    {  0.0000, -2.0000, 0.45000 }, {  1.5000,  0.0000, 0.22500 },
    {  1.5000, -0.8400, 0.22500 }, {  0.8400, -1.5000, 0.22500 },
    {  0.0000, -1.5000, 0.22500 }, {  1.5000,  0.0000, 0.15000 },
    {  1.5000, -0.8400, 0.15000 }, {  0.8400, -1.5000, 0.15000 },
    {  0.0000, -1.5000, 0.15000 }, { -1.6000,  0.0000, 2.02500 },
    { -1.6000, -0.3000, 2.02500 }, { -1.5000, -0.3000, 2.25000 },
    { -1.5000,  0.0000, 2.25000 }, { -2.3000,  0.0000, 2.02500 },
    { -2.3000, -0.3000, 2.02500 }, { -2.5000, -0.3000, 2.25000 },
    { -2.5000,  0.0000, 2.25000 }, { -2.7000,  0.0000, 2.02500 },
    { -2.7000, -0.3000, 2.02500 }, { -3.0000, -0.3000, 2.25000 },
    { -3.0000,  0.0000, 2.25000 }, { -2.7000,  0.0000, 1.80000 },
    { -2.7000, -0.3000, 1.80000 }, { -3.0000, -0.3000, 1.80000 },
    { -3.0000,  0.0000, 1.80000 }, { -2.7000,  0.0000, 1.57500 },
    { -2.7000, -0.3000, 1.57500 }, { -3.0000, -0.3000, 1.35000 },
    { -3.0000,  0.0000, 1.35000 }, { -2.5000,  0.0000, 1.12500 },
    { -2.5000, -0.3000, 1.12500 }, { -2.6500, -0.3000, 0.93750 },
    { -2.6500,  0.0000, 0.93750 }, { -2.0000, -0.3000, 0.90000 },
    { -1.9000, -0.3000, 0.60000 }, { -1.9000,  0.0000, 0.60000 },
    {  1.7000,  0.0000, 1.42500 }, {  1.7000, -0.6600, 1.42500 },
    {  1.7000, -0.6600, 0.60000 }, {  1.7000,  0.0000, 0.60000 },
    {  2.6000,  0.0000, 1.42500 }, {  2.6000, -0.6600, 1.42500 },
    {  3.1000, -0.6600, 0.82500 }, {  3.1000,  0.0000, 0.82500 },
    {  2.3000,  0.0000, 2.10000 }, {  2.3000, -0.2500, 2.10000 },
    {  2.4000, -0.2500, 2.02500 }, {  2.4000,  0.0000, 2.02500 },
    {  2.7000,  0.0000, 2.40000 }, {  2.7000, -0.2500, 2.40000 },
    {  3.3000, -0.2500, 2.40000 }, {  3.3000,  0.0000, 2.40000 },
    {  2.8000,  0.0000, 2.47500 }, {  2.8000, -0.2500, 2.47500 },
    {  3.5250, -0.2500, 2.49375 }, {  3.5250,  0.0000, 2.49375 },
    {  2.9000,  0.0000, 2.47500 }, {  2.9000, -0.1500, 2.47500 },
    {  3.4500, -0.1500, 2.51250 }, {  3.4500,  0.0000, 2.51250 },
    {  2.8000,  0.0000, 2.40000 }, {  2.8000, -0.1500, 2.40000 },
    {  3.2000, -0.1500, 2.40000 }, {  3.2000,  0.0000, 2.40000 },
    {  0.0000,  0.0000, 3.15000 }, {  0.8000,  0.0000, 3.15000 },
    {  0.8000, -0.4500, 3.15000 }, {  0.4500, -0.8000, 3.15000 },
    {  0.0000, -0.8000, 3.15000 }, {  0.0000,  0.0000, 2.85000 },
    {  1.4000,  0.0000, 2.40000 }, {  1.4000, -0.7840, 2.40000 },
    {  0.7840, -1.4000, 2.40000 }, {  0.0000, -1.4000, 2.40000 },
    {  0.4000,  0.0000, 2.55000 }, {  0.4000, -0.2240, 2.55000 },
    {  0.2240, -0.4000, 2.55000 }, {  0.0000, -0.4000, 2.55000 },
    {  1.3000,  0.0000, 2.55000 }, {  1.3000, -0.7280, 2.55000 },
    {  0.7280, -1.3000, 2.55000 }, {  0.0000, -1.3000, 2.55000 },
    {  1.3000,  0.0000, 2.40000 }, {  1.3000, -0.7280, 2.40000 },
    {  0.7280, -1.3000, 2.40000 }, {  0.0000, -1.3000, 2.40000 },
As you can probably guess, the numbers in the patch array index into the vertex array.
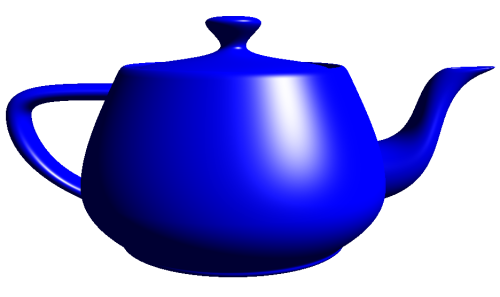
If you look again at the photo of the real teapot, you can see that it's quite a bit taller than the classic computer teapot.
he original teapot data has no bottom. Some of the data sets that are out there (depressingly, this includes the one in the GLU and GLUT distributions) have added a bottom - but that is definitely 'impure'. Here is the data for the bottom:
  Bottom:
    { 118, 118, 118, 118, 124, 122, 119, 121,
      123, 126, 125, 120,  40,  39,  38,  37 }

  Vertices 118..126:
    {  0.0000,  0.0000, 0.00000 }, {  1.4250, -0.7980, 0.00000 },
    {  1.5000,  0.0000, 0.07500 }, {  1.4250,  0.0000, 0.00000 },
    {  0.7980, -1.4250, 0.00000 }, {  0.0000, -1.5000, 0.07500 },
    {  0.0000, -1.4250, 0.00000 }, {  1.5000, -0.8400, 0.07500 },
    {  0.8400, -1.5000, 0.07500 }
How to use timer for animation
http://stackoverflow.com/questions/24217988/using-android-timers-to-implement-graphical-movement
1
|
The most common approach I have seen is somewhat different. It's more typical to update the animation while preparing to render each frame, and base the update on the amount of time that has passed since the last frame.
Since distance is velocity multiplied by time, you do this by assigning a velocity vector to each of your objects. Then when it's time to update the animation, you take the time difference since the last update, and the increment you apply to your positions is the time difference multiplied by the velocity. The velocity is constant as long as you just use a linear motion, but can also change over time for more complex animations, e.g. due to gravity, collision with other objects, etc.
If you're using OpenGL on Android, you're probably using a
GLSurfaceView for your rendering. By default, the GLSurfaceView will already invoke your rendering function continuously, up to 60 fps if your rendering can keep up with the display refresh rate.
What you roughly do is keep the time when the last frame was rendered as a member variable in your
GLSurfaceView.Renderer implementation. Then each time onDraw() is called, you get the new time, and subtract the last frame time from this time to get the time increment. Then you store away the new time in your member variable, multiply the time increment by the velocity, and add the result to your positions.
After the positions are updated, you render your objects as you normally would.
To give you the outline, the following is a slightly adapted piece of (pseudo-)code I copied from my answer to a similar question (Android timing in OpenGL ES thread is not monotonic):
Where
lastFrameTime is a member variable, currentTime a local variable. |
Here is how one grad student renders a teapot:
http://vis.berkeley.edu/~joshea/projects/bezier/
|
-
glMap1f(target, u_min, u_max, stride, order, point_array);
glEnable(target);
glEvalCoord1f(u);
-
GL_MAP1_VERTEX_3, a vertex in 3D
GL_MAP1_VERTEX_4, a vertex in 4D (homogeneous coordinates
GL_MAP1_COLOR_4, a RGBA color
GL_MAP1_NORMAL, a normal vector
GL_MAP1_TEXTURE_COORD_1, a texture coordinate. (We'll talk about textures in a few weeks.)
Open Source: OpenGL ES Curve Library For iOS
OpenGL ES does not have a built in library for curve generation, and while the formulas for creating curves can be readily found there are so many different types and it is always nice to have everything done for you. Core Animation provides a few different types of curves, but there are many more. I found out about some great open source code that performs the necessary calculations for 22 different types of curves. In case you’re wondering why you might need this data — it is extremely useful for animation. Also, this is not only an OpenGL curve library, you can use the functions for different Core Animation curves also.
The library is from Jeff Lamarche, co-author of Beginning iPhone 3 Developmentand More iPhone 3 Development books you can find out more about the functions, and see some of the examples of the curves at:
More Animation Curves Than You Can Shake A Stick At
More Animation Curves Than You Can Shake A Stick At
Further information on how to use the functions can be found at the above link.